
Standard Deviation: A Detailed Discussion with Examples

One of the most essential concepts in the study of statistics is the concept of the standard deviation (abbreviated as SD or STDEV). A statistical term used to quantify the degree of dispersion or variability in a set of data values is the standard deviation. The difference between the data points and the mean (average) value is how it is measured.
It is widely used to analyze and apprehend different sorts of facts. A smaller standard deviation precisely represents the degree of variation in the data set or provided data information on the other side a larger value of the SD or STDEV elaborates on the dispersion or spread of the data points.
In this detailed discussion, we will address the important term of the standard deviation precisely. We will explore here in this guide the famous empirical rule (68%-95%-99.7%) in a precise and concise way. Let’s dive into the details.
Standard deviation (SD or STDEV)
The standard deviation elaborates on the average (or mean) distance from the mean (x̅ or μ) that a single data value is from the mean (x̅ or μ). However, any given observation in your given data may deviate more or less from the average point or mean. The standard deviation units allow us to express the distance in terms of standard deviations between any point in a data collection and the data set mean.
Depending on whether you are using a sample or the entire population, there are differences in the formula for calculating the standard deviation. The standard deviation formula has two forms: one for the entire population and another for a specific subset or sample.
When we have data on a portion of the population, we use the sample standard deviation (SSD), and when we have data on the whole population, we use the population standard deviation (PSD).
SDTEV or SD for population data:
- SD POPULATION (σ) = √ [Σ (xk – μ)2 / N]
SDTEV or SD for sample data:
- SD SAMPLE (S) = √ [Σ (xk – x̅)2 / (N – 1)]
SDTEV and The Empirical Rule (68% - 95% - 99.7%):
- 68% of all the data values exist within one standard deviation of the mean (μ ± σ).
- 95% of all the data values exist within two standard deviations of the mean (μ ± 2σ).
- And 7% of all the data values exist within three standard deviations of the mean (μ ± 3σ).
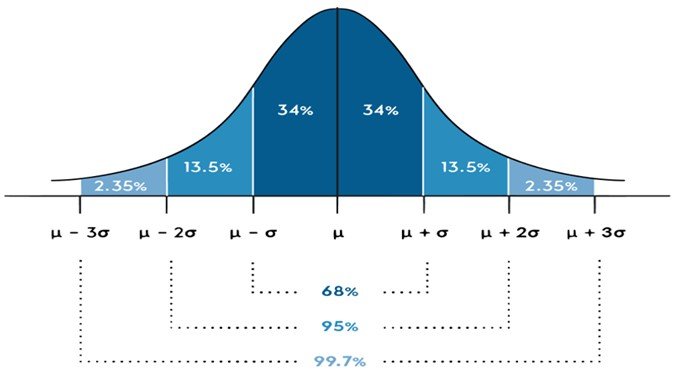
We can examine that in a normal distribution, 68% of observations fall between 1σ and the mean, 95% fall between 2σ and the mean, and 99.7% fall between 3σ and the mean by applying the empirical rule. Since a normal distribution is symmetric about the mean, we can estimate probabilities for smaller portions of the distribution by further dividing the regions under a normal distribution (refer to the picture above). As an illustration, we can also say that 34% of observations fall between the mean and one standard deviation above the mean or that only 2.35% of the data fall between (μ – 3σ) and (μ – 2σ).
How to find the standard deviation?
Now are going to elaborate on this useful concept by addressing some examples precisely.
Example 1:
Below in the table, are mentioned different cities and their respective lowest temperatures recorded during the winter. Determine step-by-step the standard deviation.
City | ISB | FSD | LHR | DIG | DIK | RWP | GRW | SKR | SFD | KR |
Temp ( xk) | 3 | 7 | 9 | 13 | 18 | 17 | 19 | 21 | 24 | 29 |
SOLUTION:
Step 1: First of all, compute the average (x̅ or μ) of the above-given data values.
x̅ or μ = (3 + 7 + 9 + 13 + 18 + 17 + 19 + 21 +24 + 29) / 10
x̅ or μ = (160) / 10
x̅ or μ = 16
Step 2: Now we will determine the following useful computations that are necessary to calculate the standard deviation:
x | (xk – x̅ = xk – μ) | (xk – x̅)2 = (xk – μ)2 |
3 | -13 | 169 |
7 | -9 | 81 |
9 | -7 | 49 |
13 | -3 | 9 |
18 | 2 | 4 |
17 | 1 | 1 |
19 | 3 | 9 |
21 | 5 | 25 |
24 | 8 | 64 |
29 | 13 | 169 |
Σ |
| 580 |
Step 3: Applying the relevant formula to compute the population standard deviation (PSD or PSTDEV):
SD POPULATION (σ) = √ [Σ (xk – μ) 2 / N]
SD POPULATION (σ) = √ [(580) / 10]
SD POPULATION (σ) = √ (58)
SD POPULATION (σ) = 7.6158 Ans.
Applying the relevant formula to compute the sample standard deviation (SSD or SSTDEV):
SD SAMPLE (S) = √ [Σ (xk – x̅)2 / (N – 1)]
SD SAMPLE (S) = √ [(580) / (10 – 1)]
SD SAMPLE (S) = √ [(580) / 9]
SD SAMPLE (S) = √ (64.44)
SD SAMPLE (S) = 8.0277
Example 2:
For the given data values 90, 73, 78, 79, 83, 95, 77, 79, 74, 81. Find step-by-step the standard deviation.
SOLUTION:
Step 1: First of all, compute the average (x̅ or μ) of the above-given data values.
x̅ or μ = (90 + 73 + 78 + 79 + 83 + 95, 77 + 79 + 74 + 81) / 10
x̅ or μ = (810) / 10
x̅ or μ = 81
Step 2: Now we will determine the following useful computations that are necessary to calculate the standard deviation:
x | (xk – x̅ = xk – μ) | (xk – x̅)2 = (xk – μ)2 |
90 | 9 | 81 |
73 | -8 | 64 |
78 | -3 | 9 |
79 | -2 | 4 |
83 | 2 | 4 |
95 | 14 | 196 |
77 | -4 | 16 |
79 | -2 | 4 |
74 | -7 | 49 |
81 | 0 | 0 |
Σ |
| 427 |
Step 3: Applying the relevant formula to compute the population standard deviation (PSD or PSTDEV):
SD POPULATION (σ) = √ [Σ (xk – μ) 2 / N]
SD POPULATION (σ) = √ [(427) / 10]
SD POPULATION (σ) = √ (42.7)
SD POPULATION (σ) = 6.5345
Applying the relevant formula to compute the sample standard deviation (SSD or SSTDEV):
SD SAMPLE (S) = √ [Σ (xk – x̅)2 / (N – 1)]
SD SAMPLE (S) = √ [(427) / (10 – 1)]
SD SAMPLE (S) = √ [(427) / 9]
SD SAMPLE (S) = √ (47.44)
SD SAMPLE (S) = 6.8877
The problems of finding sample and population standard deviation can also be solved by using an online standard deviation calculator to get rid of time taking manual calculations.
Wrap Up
In this detailed discussion, we have explored the concept of the standard deviation in in-depth. We have elaborated on the empirical rule in detail. If ungrouped data is given, we have provided a comprehensive explanation with solved examples of how to calculate the population standard deviation and sample standard deviation. We hope that after reading this post, you will be able to answer standard deviation problems with ease.